Practice Analysis
Practice Analysis
This is one of the most used reports in the System due to the output calculations and the ability to create multiple Group By levels.
Report Features
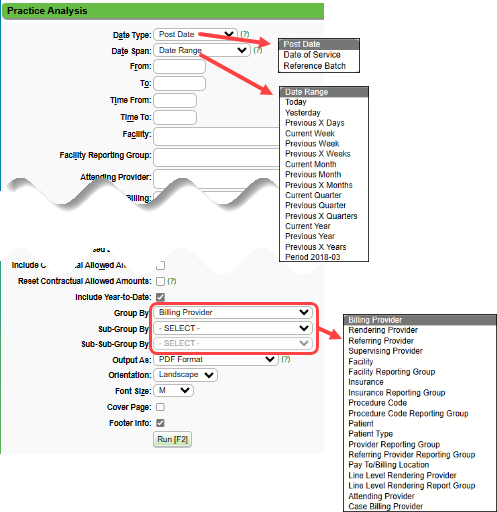
- Date Type allows reporting by Post Date, Date of Service, or on an individual Reference Batch.
- Include/Exclude/Only
- Resolved Tags
- Self Pay: Includes Charges that were:
- Self Pay when the Charges were first entered.
- The Charges were entered originally as Insurance, but the Profile was changed to Self Pay. The Profile can only be changed if NO Transactions are entered against the Insurance.
- The Balance cannot be transferred from the Insurance to Self Pay. The Profile must be changed.
- Modifier: Enter a Modifier to filter for the Primary Modifier on the Encounter.
- POS: All/Exclude POS Payments/POS Payments Only
- Checkboxes:
- Include Collections
- Exclude Reversed Encounters
- Include Contractual Allowed Amounts
- Reset Contractual Allowed Amounts: Select the checkbox if changes were made to the Allowed Fee Schedule since the most Recent Period End Close.
- This will add processing time to the Report, but will ensure that the recent changes are used in the calculations.
- Include Year-to-Date
- Group By driven: Insurance, Provider, Facility, Procedure Code, etc. with 3 "Group By" levels. See example below.
- Group Reporting: Facility Groups, Insurance Groups, Procedure Code Groups, & Referring Groups.
- RVUs: These values come from the Work RVU Fee Schedule.
- Percentage of Charges per Group By.
Run the Report by Post Date
Run the report by Post Date for accounting purposes. The Report will include Encounters, Payments, and Adjustments that match the Post Date range chosen. The Payments and Adjustments may not have any direct relationship. It is simply the what was posted during that time period.
Run the Report by DOS
The Report will include all Encounters for the Date of Service range chosen. The Payments and Adjustments will be the ones applied to the Encounters in the DOS range. The Charges and Payments have a direct correlation. These numbers are expected to change over time as more Payments are received and posted against these Charges.
Column Definitions
Transfers
The money moved (transferred) from/to the next responsible party.

Chg% = Charge%
This is a calculated field that divides the Dollars Charged for a Provider, Facility, etc. by the total Dollars Charged.
- This should always equal 100% in the Total.
Prof% = Profit%
This is a calculated field: Payments divided by (Payments + Write Offs + Adjustments).
Net
The Net Total Calculation: Charges minus Payments plus Refunds minus Adjustments minus Write Offs.
- If the Net Total is negative:
- It may reflect that more A/R was worked than the total of Charges posted during the date range, or
- It may reflect that the Provider is not getting as many Charges added, such as being on vacation or time off during the holidays.
RVU
RVU is calculated by the number of CPT® units billed times the RVU amount associated with the CPT® record. If run by post date, all charges and payments within the chosen time frame are reported.
YTD (Year to Date)
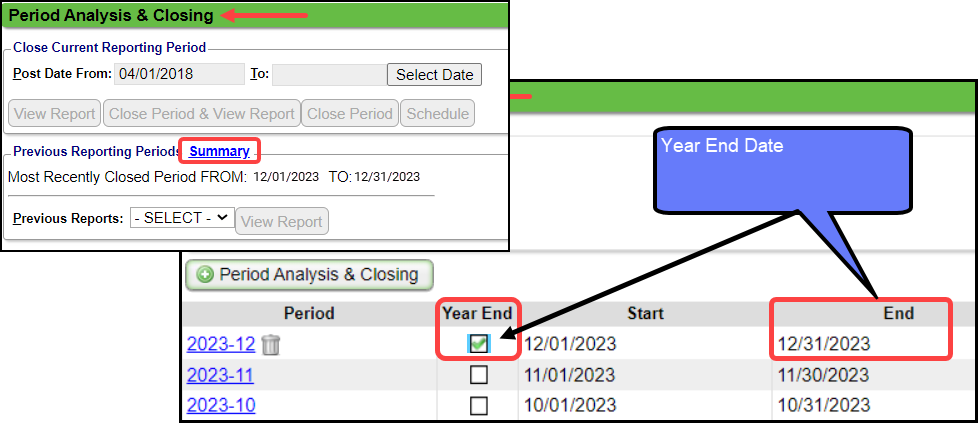
YTD totals are driven by Year End being checked when running the Period Analysis and Closing Report for the last period of the Year.
- If the Year End checkbox is selected, the System recognizes this as the end of your fiscal year.
- If Year End is not selected on any Period Closings, the System Defaults to January 1.
- If you compare another report to the YTD numbers in the Practice Analysis Report, you need to verify that the start day is the same as the Period Analysis YTD Start and End Dates.
- How do I know when my Start and End Dates are for my YTD totals?
- View the Closed Period Summary (Reports > Period Analysis & Closing > select Summary)
- Look for the check mark in the Year End column.
- If the End Date is 12/31/22, the new YTD begins on 01/01/23.
Example: If the YTD Start Date is 07/01/2022 and the YTD End Date is 06/30/2023, the next YTD Start Date would begin on 07/01/23. The first Post Date of the year is 07/01/2023 and this date should be used as the From Date when running comparative reports.Patients
Encounters
The Total in this column may not equal the sum of each line item number. This is by design.
Visits
The number of Visits is calculated by a distinct Date of Service.
- If a Patient has multiple Encounters with the same DOS, they will be counted as 1 Visit.
- If a Patient has 1 Encounter that has multiple Dates of Service, each DOS will count as 1 Visit.
- If the Report is Grouped by Billing Provider, and a Patient has 2 Encounters with the same Date of Service with different Billing Providers, it will only be counted once towards the Total, but 1 Visit will be counted individually for each Billing Provider.
- If the Report is Grouped by Billing Provider and there is 1 Encounter with 2 different Providers on 2 different Charge Line Items, it will Total by the Billing Provider on the Claim Level.
Examples:
- A Patient has 4 Charge lines with the same Date of Service: This will count as 1 Visit because there is only 1 DOS.
- A Patient has 1 Encounter with 5 different Dates of Service: This will count as 5 Visits because the DOS is different for each one.
- If the Report is Grouped by Billing Provider: A Patient has 2 Encounters with the same DOS with different Billing Providers.
- Provider A will have 1 Visit
- Provider B will have 1 Visit
- The Total Visits will be 1 Visit not 2.
- If the Report is Grouped by Billing Provider: A Patient has 1 Encounter with 2 Charge Line Items with the same DOS and different Providers on the Charge Line Items.
- The Billing Provider on the Claim Level will have 1 Visit because the report does not pull the Provider from the Charge Line Item.
- The Total Visits will be 1.
Report Examples:
Related Articles
Reports System Settings
AGINGBUCKETS AGING REPORT AGE GROUPS Determines the aging buckets on Interactive Aging and reports that include aging buckets. Values need to be comma-separated; i.e. 30,60,90,120 AGINGINS AGING REPORT DEFAULT FROM DATE Sets the default "Aging by" ...A/R Reports Overview
A/R Reports do not include Incomplete Charges. Account Receivable Reports Practice Analysis A/R Analysis A/R Management Year End Interactive Aging Report Aging by Patient BI: A/R Dashboard Date Filters When comparing reports, be sure you use the same ...Productivity Analysis Report
Productivity Analysis Report The Productivity Analysis Report contains Totals for Receipts, Charges, and Applied Payments grouped by specific categories. Access the Productivity Analysis Report: From Reports on the Left Side Menu, select the ...Reports Criteria Overview
Most Reports default to the Post Date which is controlled by the date used in the Reference Batch. My Reports Panel: The Reports that the User has run are shown in this Panel. You can choose to see Unread reports only. Report History: This is the ...Payroll Report
Note: The Payroll Report cannot be run with a single total. Instead, use the Practice Analysis Report. The Payroll Report calculates the total amount of Revenue generated by a Procedure (displayed by the Procedure Code) for a Provider and reports the ...