Interactive Aging: Real-Time A/R View
Interactive Aging: Real-Time A/R View

This report is not meant to balance to the Period End Report.
The Interactive Aging Report is a real-time A/R Report. It can be grouped and aged dynamically. If the Bill Date is chosen as the Aging Date, and there is no Bill Date the System uses the Responsibility Date as the fallback date. This Report does not include Collections.
Access the Interactive Aging Report
This report can be accessed from the Home Dashboard or the Navigation Search Box. It cannot be accessed from the Report Dashboard.
- On the Home Dashboard, select the Interactive Aging Report (IA) or enter IA in the Navigation Search Box.
- Use the Filter Criteria to specify the data in the Report.
Filter Criteria of the Interactive Aging Report
- Total-By Options: The Total-By entity that is chosen creates a row for each item with Column totals.
- Insurance (Default)
- Insurance Reporting Group
- Insurance CFI
- Employer
- TPA
- Facility
- Facility Reporting Group
- Billing Provider
- Rendering Provider
- Referring Provider
- Provider Reporting Group
- Statement Profile
- Tag
- Timely Filing
- Payer ID
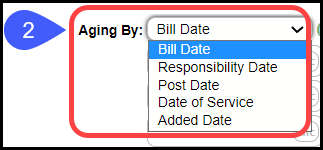
- Aging By: Bill Date, Responsibility Date, Post Date, Date of Service, or Added Date.

- A/R: Billed or Expected
- Billed: Displays outstanding A/R by the amount that was billed.
- Expected: Allows clients to forecast the expected amount that will be collected on unpaid balances. Using A/R by Expected amount instead of the Billed amount gives a more realistic assessment of the A/R. Learn More: Configure Settings.
- Credits: Include, Exclude, or Only: With the Include/Exclude/Only Credit filter, each Responsible Party balance is taken into consideration. This makes it easy to isolate individual Credit Balances.
- Unbilled: Include, Exclude, or Only

- Insurance
- Insurance Reporting Group

- Facility
- Facility Reporting Group
- Billing

- Billing Reporting Group
- Rendering
- Rendering Reporting Group
- Referring
- CPT® Code: When using the CPT® filter, the System returns the balance for all Procedure Codes associated with an Encounter if at least one of the Procedure Codes specified in the filter is present on the Encounter.

- Statement Profile
- Tag Attributes
- Tags
- DOS From
- DOS To

- Employer on Policy: Include is the Default
- Employer as Guarantor: Include is the Default
- Resolved Tags: Exclude is the Default.

- Include Reversed Encounters
- Include Percentages: Select to display Percentage of A/R in each Aging category.

Features of the Interactive Aging Report
- Ability to sort by columns: Click one of the Headings on the Report to sort.
- Export the Interactive Aging list to Excel/CSV or PDF.
- Click on the Aging Column links to Navigate to the Encounters by Status List for Items in that particular category.
- Includes Insurance and Patient Aging Categories when Totaled By Insurance and Insurance Reporting Group.
Encounters by Status List
- Export the Report results to an Encounter Worklist for follow-up.
- Add Individual Encounters to an Encounter Worklist.
- Interactive: Navigate to the Patient or Encounter Dashboard using the Patient/Encounter ID links in the Report.
- View Claim Status. Hover over the Status abbreviation to see the meaning.
- Key Performance Indicator threshold % triggers red highlights.
- Thresholds are entered in the Admin Dashboard > System Settings > Reports.
- Thresholds can be set separately for Patient A/R.
Patient Aging
Patient Aging Totals are located at the bottom of the Interactive Aging report.
- Patient - After Insurance: This is the Patient Responsibility Totals after Insurance has paid.
- Patient - Self Pay: This is Patient Responsibility for Patients that do not have any Insurance.
Run Patient Aging Only
Filters Criteria
- Totals By: Choose Insurance.
- Insurance: Enter Pat and choose Patient.
- Click Search.
Example of Report with Percentages
Total by Statement Profiles
- Filtered for Patient balances only. Choose Patient for the Insurance.
Learn More
A/R Reports Overview
Unresolved Claims Report
Use Interactive Aging to Report on Timely Filing
Related Articles
A/R Analysis
Gives a Day by Day, Week by Week, Month by Month, or Year by Year tracking of changes in the A/R. This report allows you to Group By and Sub-Group By. If the Days in A/R is blank: The System was not able to calculate a valid value. This is usually ...A/R Reports Overview
A/R Reports do not include Incomplete Charges. Account Receivable Reports Practice Analysis A/R Analysis A/R Management Year End Interactive Aging Report Aging by Patient BI: A/R Dashboard Date Filters When comparing reports, be sure you use the same ...Aging by Patient Report
Aging by Patient Report The Aging by Patient Report can be used for outstanding Patient/Insurance balances, Patient/Insurance credits, and Escrow. This is similar to the Unresolved Claims Report and Interactive Aging. Patient Escrow is highlighted in ...Real-Time Claim Status
*This is a Premium Add-on feature. Common Problems with manually checking Claim Status Challenge of timely follow-up on Insurance Claims that are delayed or have no response from the Payer. A Claim can appear to be Payer Accepted, but the Claim has ...A/R Management Report
The A/R Management Report can be run with a variety of Criteria and breakdowns. This report shows the details of the A/R changes, with Aging breakdown, or can be run for the Aging breakdown only, which gives a display much like the Interactive Aging ...