My Favorite Reports and My Reports Panels
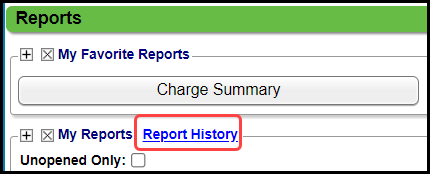
My Favorite Reports Panel
Any of the Report Buttons on the Reports Dashboard can be saved in the My Favorite Reports panel, making it easier to find the reports that you often use.
- Selecting a Report Button opens the Report Criteria screen.
- At the top of the screen, select the Add To My Favorite Reports checkbox.
The Report Button will display in the My Favorite Reports panel.
This does not save a specific Report that you have set up. It saves the button only for quick access. However, any reports that you have set up and saved previously will be available when you select the button.
My Reports Panel
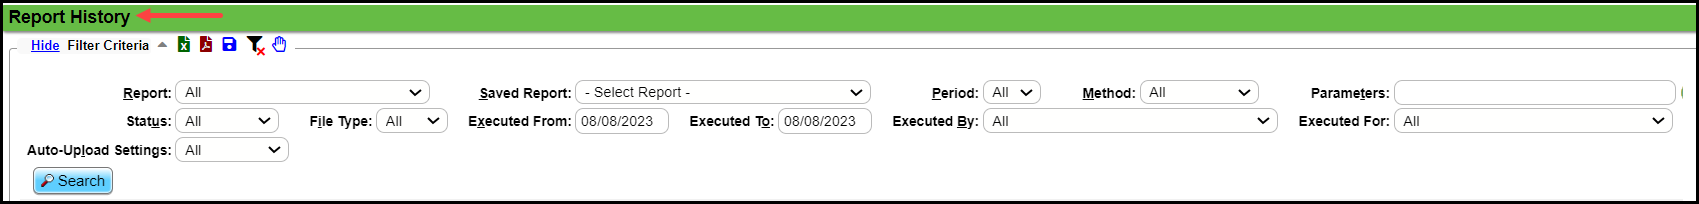
Report History
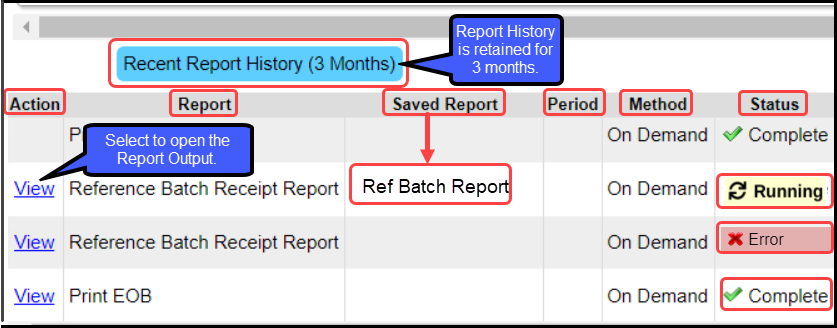
Report History is a comprehensive view of Reports that have been generated in the last 3 months.
- Access is driven by your Permissions.
Report History Filters
- Select the Report History link to view Reports that have been run previously.
- The Column Titles represent the Report Filters that are available with the exception of Auto-Upload Settings and PHI columns.
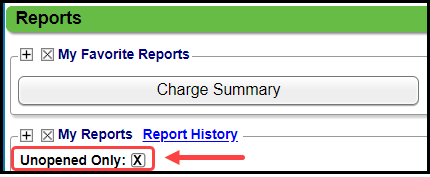
- Unopened Only: Select the checkbox to filter only for the Reports that have not been opened.
Report Filters and Columns
- Action:
- View: Select the link to open the Report Output of previously run reports without running the report again.
- Report: Report type, such as Practice Analysis, Daily Charges, Daily Sheet, etc.
- Saved Report: Saved Report name
- Period: Represents the Closed Period when the report was run.
- Method: On Demand or Scheduled
- Status:
- All: Displays Running, Complete, and Error
- Running: The report has not finished its calculations.
- It will continue to run and calculate at the Database level even if you navigate away from the Report Filters screen or log off before the Report is finished.
- The Report will display in the Recent Report History panel with the Status of Running until the calculations are completed.
- Complete: The Report has finished its calculations and produced an output.
- Error: The report did not produce an output because of an Error.
- Executed From and To:
- Use the Filters to qualify the run dates to view reports run by specified dates.
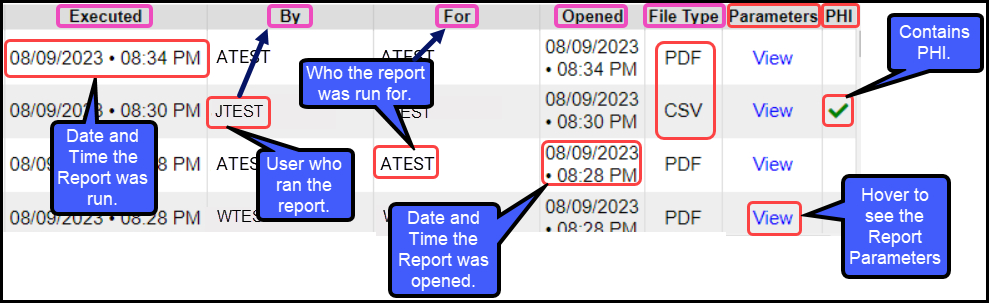
- The Executed column shows the date and time the report was run.
- Executed By: The User that ran the report
- Executed For: The person who the report was run for
- Opened: The column displays the date and time the Report was opened.
- File Type: PDF, CSV, XLS, TXT
- Parameters:
- Hover over View in the Parameters column to display the Filter Criteria that was used.
- Use the Parameters Filter to view reports with that specific criteria.
- Example: Find all reports that were run with Landscape orientation by entering Landscape in the filter.
- Auto-Upload Settings Filter: Use to display auto uploaded reports.
- PHI: The green check mark indicates that the report contains Protected Health Information (PHI).
Learn More
Related Articles
Custom Query Reports Hub
Custom Query Reports (CQR) Custom Encounter Query = CEQ Custom Receipt Query = CRQ Custom Transaction Query = CTQ Custom Patient Query = CPQ Custom Appointment Query = CAQ Overview Filters and Criteria Create a CQR CEQ CRQ CTQ CPQ CAQ Overview Custom ...Reports Criteria Overview
Most Reports default to the Post Date which is controlled by the date used in the Reference Batch. My Reports Panel: The Reports that the User has run are shown in this Panel. You can choose to see Unread reports only. Report History: This is the ...Custom Query Reports Overview
Custom Query Reports Overview Custom Query Reports can be custom-built to produce the output and columns you want specifically. A Default Report is System delivered for each Custom Query Report. They all operate in the same way but pull specific ...Allowed Fee Exception Report
To find underpayments, this report compares posted allowed amounts to contractual allowed amounts. The Allowed Fee Exceptions Report shows discrepancies on Posted Allowed amounts against the Allowed Fee Schedule. It does not report on CO's and ...Schedule Reports using the Job Scheduler
Reports can be scheduled to run automatically. Date Span options allow for relative options, such as, Yesterday, Current Week, Previous Month, Period End, Previous X days, weeks, months, years, etc. For Example: If the report is set up to always run ...