Executive Summary Calculations
Executive Summary Calculations
The Executive Summary Report provides Monthly totals incorporating key revenue cycle KPI components, broken down for each month over a 12 month reporting period.
- Net Payments: The Dollars Posted for the selected time period, not the Dollars Received.
- Payments and Receipts are fundamentally different and will not be reported the same.
- Learn more: Receipt vs. Payment Information
- These KPI calculations are filtered by the Primary Insurance:
- Net Collection Rate
- Gross Collection Rate
- Calculated Allowance Rate
- Bad Debt Ratio
Lookback Period and Lookback Lag: Lookback and Lag determine the data that is included in the Report.
The Lag Time (Lookback Lag) removes the most recent month(s) to allow time for Payments, Adjustments, and other activity to fully process, resulting in more mature and accurate data.
The Lookback Period defines how many months of completed data to review, starting after the Lag.
Twelve-Month Calculation
- Calculated by Post Date.
- The calculation is the same as the Practice Analysis Report when run by the same criteria.
- Beginning & Ending A/R (Charges, Payments, Adjustments, and Write-offs).
- Calculation of Ending A/R: Beginning A/R plus Charges minus Net Payments minus All Adjustments
- The Beginning and Ending A/R are available on the A/R Analysis Report.
- Bad Debt is broken down into:
- To Collections (Net): WOCOL and Reversal of Collections (WOPR)
- Other Write-offs
- Work RVUs
- # of Patients: The Patient is counted once even if the person has had more than one Encounter during the specified period.
- # of Encounters
- # of Visits: The number of Visits is calculated by a distinct Date of Service.
- # of Units: Total number of Units billed.
6-Month Review
Starting with the current month, a Lookback of 6 months and a Lag Time of 3 months:
Current Month: Through Date: December 2025
- Lag Time
- December = Month 0
- November = Month 1
- October = Month 2
- September = Month 3 (Lag Time)
- Lookback Period 6 months: Starting with September, count back 6 months. (September 2025 to April 2025)
- September 2025
- August 2025
- July 2025
- June 2025
- May 2025
- April 2025
For all of the 6-month Lookback Review KPIs used as examples below, these parameters will be used:
- Report is run through December 2024
- Lookback Period: 6 months
- Lookback Lag: 3 months
- September 2025 to April 2025
- Includes only Zero balance Encounters
- Charges = 326,188.10
- Posted Payments = 355,403.52
- Refunds = 0.00
- Posted Allowed Amounts = 360,246.91
- CO45 Adjustments = 1,941.19
Calculated by Month
Charges per Encounter: Total Charges for the month divided by Total number of Encounters for the month
Revenue per Encounter: Payments collected for the month divided by Total number of Encounters for the month
Charges per Unit: Total Charges for the month divided by Total number of Units for the month
Revenue per Unit: Total Payments for the month divided by Total number of Units for the month
Charges per Patient: Total Charges for the month divided by Total number of Patients for the month (See # of Patients above)
Revenue per Patient: Total Payments for the month divided by Total number of Patients for the month (See # of Patients above)
Charges per Visit: Total Charges for the month divided by Total Visits for the month (calculated by a distinct Date of Service)
Revenue per Visit: Total Payments divided by Total Visits (calculated by a distinct Date of Service)
Calculated Allowance Rate (Uses 3-month lookback for 6 months)
The Calculated Allowance Rate is the percentage of Contractual Adjustments.
Calculation
- (Charges minus Adjustments) divided by Total Charges or CO45 Adjustments divided by Total Charges
- The Calculated Allowance Rate is filtered by the Primary Insurance.
Example
- (Charges - CO45 Adjustments) / Total Charges x 100 = Percentage Allowance Rate
- (362,188.10 - 1,941.19) / 362,188.10* 100 = 99.5%
- CO45 Adjustments / Total Charges x 100 = Percentage of Contractual Adjustments
- 620.18 / 326362.85 x 100 = 0.2%
Net Collection Rate (Uses 3-month lookback for 6 months)
The Net Collection Rate shows the effectiveness of your practice at collecting the reimbursements that are Allowed.
- The goal is to get this KPI as close to 100% as possible.
- This KPI is generated by DOS, so for the reporting month you are seeing Encounters that fall within the Lookback Period and all Payments posted against those Charges.
- The Net Collection Rate is filtered by the Primary Insurance.
Calculation
- Net Payments (payments minus refunds) divided by posted Allowed amounts.
Example:
- Payments - Refunds / Posted Allowed Amounts (Charges minus Posted Allowed Amounts) * 100
- ( 355,403.52 - 0.00) / (362,188.10-1,941.19) * 100 = 98.6%
- The Net Collection Rate is 98.6%
Gross Collection Rate (Uses 3-month lookback for 6 months)
The Gross Collection Rate is a comparison of your fees to what you were actually paid.
- A high Gross Collection Rate means your fees are close to the amount payers have paid.
- The Gross Collection Rate is filtered by the Primary Insurance.
Calculation
- Net Payments (payments minus refunds) divided by Charges.
- This KPI is generated by DOS, so for the reporting month you are seeing visits that were performed in that month and all payments posted against those charges.
Bad Debt Ratio Calculation
- Write-offs for the reported month divided by Average Posted Allowed amounts of the lag period.
- The Bad Debt Ratio Calculation is filtered by the Primary Insurance.

Days in A/R

- The example reveals a problem with the Claims being paid in a timely manner.
Days in A/R = Accounts Receivable divided by Average Amount Charged in One Day
Accounts Receivable: (Charges - Payments - Adjustments - Write-Offs + Refunds +/- Transfers)
Average Amount Charged in One Day: ((Sum of Charges in Lookback Months) divided by (Billing Days)).
- 196,568.43 / (810,735.74/365) = 195,486.23 / 2221.19 = 88 Days
What Part of the Workflow is the Problem?
The sections below can reveal where the workflow is lacking so that it can be addressed.
- Is it taking too long to Add, Complete, or Submission of the Charges?
- Is there a problem with Rejections from a specific Payer?
- Is there a problem with a specific Provider?
- Are there too many Claims that are not being accepted at the Clearinghouse level?
Average Days to Add
This is the Average number of days that it takes to add the Charges after the Dates of Service.
- The difference of the Days from the Date of Service to the Date Added (Posted) is summed for all Encounters posted for the month and divided by the Total number of Encounters posted for the month.
- Example for the month of October:
- Encounter 1
- Date of Service: 10/29/22
- Added (Posted) Date: 10/31/22
- Days to Add: 2
- Encounter 2
- Date of Service: 10/28/22
- Added (Posted) Date: 10/31/22
- Days to Add: 3
- Encounter 3
- Date of Service: 10/30/22
- Added (Posted) Date: 11/01/22
- Days to Add: 2
- Calculation: Sum of "Days to Add" (2 + 3) divided by 2 Encounters
- Average Days to Add: 5 divided by 2 = 2.5 Days
- Encounter 3 was not included because it was posted in November, whereas, Encounter 1 & 2 were posted in October.
Average Days to Complete an Encounter
This is the Average number of days from the Added Date to Charge Completion.
- The difference of the Days from the Date Added to the Completion Date is summed for all Encounters posted for the month and divided by the Total number of Claims Posted for the month.
Average Days to Bill an Encounter
This is the average number of days from the Completion Date.
- The difference of the Days from the Completion Date to the first Claims Submission Date is summed for all Encounters posted for the month and divided by the Total number of Claims Submitted to the Clearinghouse for the month.
Average Total Days to Bill an Encounter
This is the Average number of Days from the Date of Service to the Billed Date.
- The difference of the Days from the Date of Service to the first Claims Submission Date is summed for all Encounters posted for the month and divided by the Total number of Claims Submitted to the Clearinghouse for the month.
Charges Billed within 48 hours
This is the number of charges that are sent to the clearinghouse within 48 hours based on the service date and the date billed (submitted).
- Billed Within 48 Hours = Number of Charges with: (Charge Date of Service - Earliest Date Sent to Clearinghouse) less than or equal to 2 divided by Total Number of Claims Sent multiplied by 100.
Claims Billed %
This is the percentage of Encounters posted in the month that have been billed to an insurance company in that same month, either electronically or printed to mail.
- This does not include self-pay.
Clean Claim Rate: Clearinghouse
This is the percentage of Claims sent to the Clearinghouse that were accepted by the Clearinghouse on the first Submission.
- Total Number of Claims Sent minus the Number of Claims Rejected by the Clearinghouse divided by the Total Number of Claims Sent multiplied by 100.
Clean Claim Rate: Payer
This is the percentage of Claims sent to the Payer that were accepted by the Payer on the first Submission.
- Total Number of Claims Sent minus the Number of Claims Rejected by the Payer divided by the Total Number of Claims Sent multiplied by 100.
Sections Panel
Use the check boxes in the Sections Panel to include them in the Executive Summary Report.
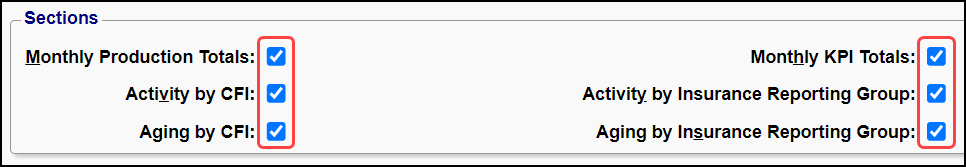
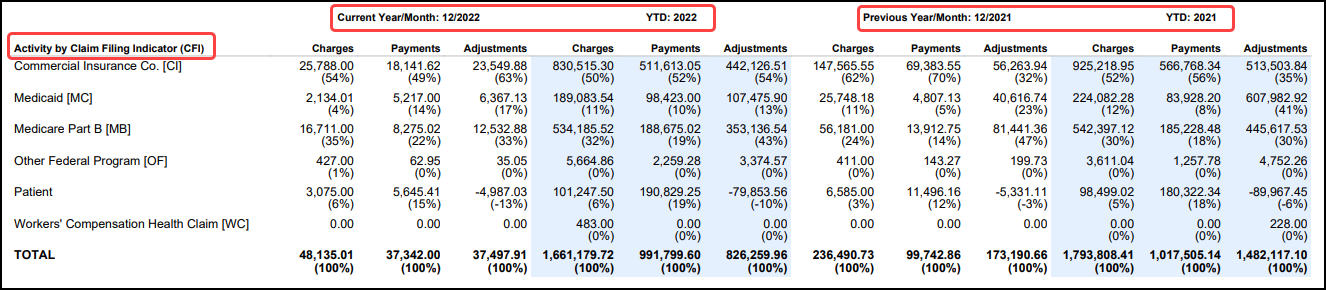
Activity by Claim Filing Indicator (CFI)
Select the Activity by CFI check box to include a comparison by CFI of the Current Year to the Previous Year.
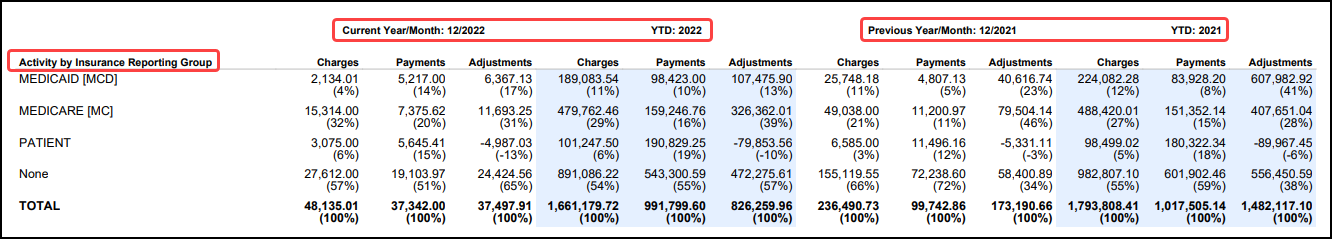
Activity by Insurance Reporting Group
Select the Activity by Insurance Reporting Group to include the comparison of the Current Year to the Previous Year.
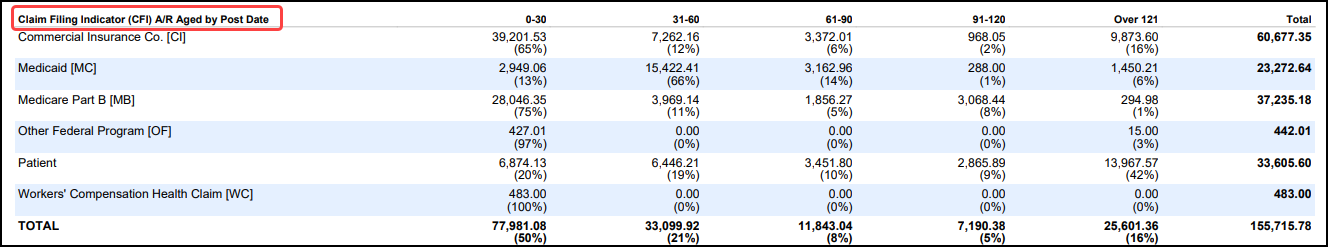
Aging by CFI
- By Bill Date
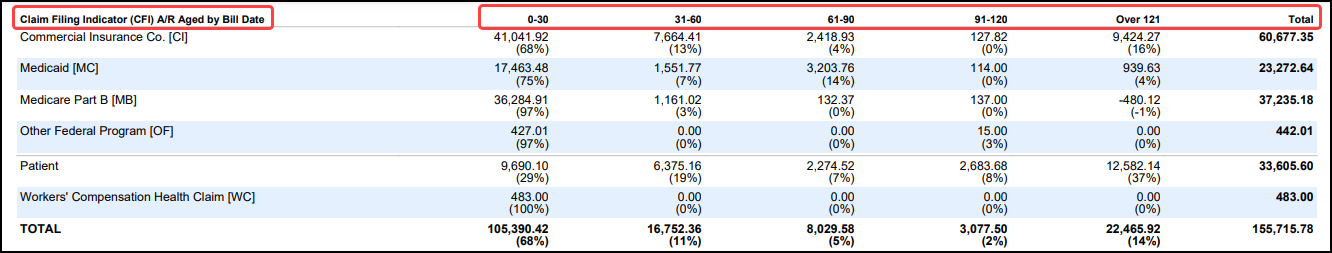
- By Post Date
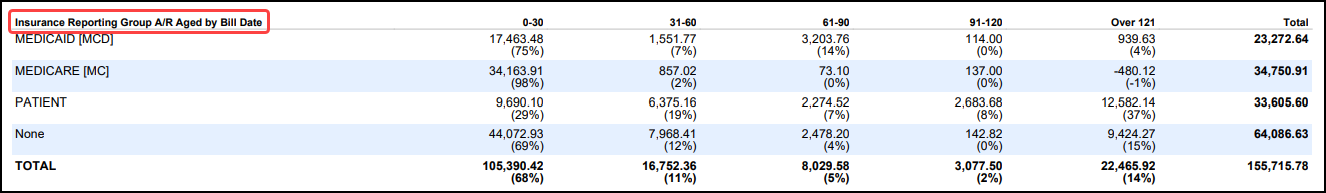
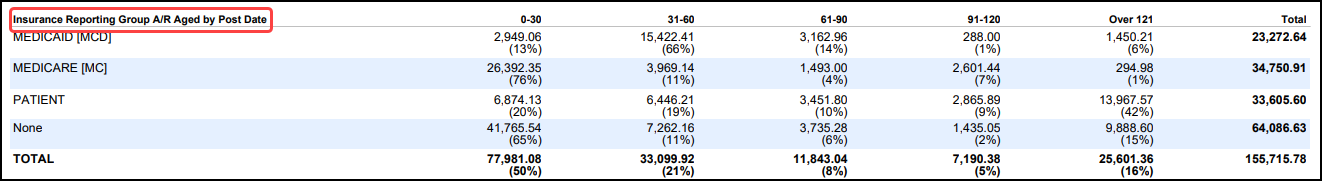
Aging by Insurance Reporting Group
- By Bill Date
- By Post Date
Logic for Changes in KPI Reporting
Why did my KPI numbers change from previous months?
The Executive Summary is a trending analysis report showing the last 12 months.
- For Financial Reports, the Post Dates are locked when a period is closed.
- With billing KPIs for healthcare A/R, the work and resolution of specific Encounters and Claims roll from one month to the next and will ultimately change the KPI going forward.
KPI Examples
Gross Collection, Calculated Allowance, and the Net Collection:
- These are not static because they are filtered/grouped by DOS, and the balance on the Encounter must be $0.00 in order to be included in the metrics' calculations.
- Encounters reach a $0.00 balance over time, and the metrics fluctuate as the balances resolve.
Bad Debt Ratio:
- This is filtered/grouped by DOS.
- Filtered by the Primary Insurance.
- The calculation compares average allowed amounts to write-offs.
- When Allowed amounts are posted against Charges in previous months, the Average Allowed amount that is used in the calculation is adjusted.
Average days to Add, Average Days to Bill, and Total Days to Bill
- These are filtered/grouped by the Post Date on the Encounter.
- Slight variations are expected. For example:
- When Encounters are Reversed, they are filtered out for these metrics.
- With Days to Bill, an Encounter can be posted at the end of the month and not billed until the next month.
- If you run the report before the Encounter is billed and run it again after the Encounter is billed, the numbers can change.
Clean Claim Rates
- These are filtered/grouped by the Post Date on the Encounter.
- If a rejection is received today for a Claim on an Encounter that was posted last month, the rate will be expected to drop a little.
Learn More
Executive Summary Overview
Why Use the Executive Summary Report?
Related Articles
Executive Summary Report Overview
Executive Summary Report The Executive Summary Report provides Monthly totals incorporating key revenue cycle KPI components, broken down for each month over a 12 month reporting period. Report Features Beginning & Ending A/R (Charges, Payments, ...Charge Summary Report
Charge Summary Overview The Charge Summary Report is found on the Reports Dashboard. Use Filters and Reporting Groups to determine the information that appears on the Report. Use the Save Report Filters to retain the same filters for running later. ...Authorization Report
Authorization Report It is recommended to run this report in Landscape orientation. Authorization Report Criteria The Authorization Report can track your Authorizations by: Insurance Expiration Date Span Remaining Visits, Dollars, Days, or Units Case ...Why use the Executive Summary Report?
Why should you care about using a report to identify Key Performance Indicators? Performance can be measured over a specific time period Staff transparency and accountability Identifies problem areas Increased Revenue Better overall delivery of care ...Encounters by Status Report
Encounters by Status Report The Encounters by Status Report is useful for seeing the Status Encounters are in currently and historically with a breakdown of Statuses at the end. The report will return a maximum of 100,000 Encounters. If your result ...